A good start
Modern ultrasound systems come with a myriad of controls and functions. Amongst these are a number of different modes which can be used for different clinical applications. This article will examine some of the most commonly available scanning modes and how they are used.
.jpg)
The earliest ultrasound mode showed returning echoes in a one dimensional, graphical format (Figure 1). Known as amplitude or A-mode, the information could be used to measure the distance between, or thickness of, tissues. An example is examining the cornea, lens and chambers of the eye.
Figure 1. A-mode represents the ultrasound echoes returning from tissue interfaces (black bars 1,2 and 3), as peaks on the graph in the lower part of the illustration. The amplitude of each returning echo decreases over time due to ultrasound attenuation.
A-mode has been superseded by other scanning modes, and most systems do not have an A-mode function. However, the principles of A-mode are directly related to the other, more commonly used, ultrasound modes.
B = Normal
“B” or Brightness mode represents the amplitude peaks seen in A-mode as dots or pixels of varying brightness (Figure 2).
.jpg)
Figure 2. The amplitude trace of A-mode is shown on the left with the corresponding B-mode image illustrated on the right. Each of the peaks seen in A-mode are depicted as dots of a varying greyscale. The brightness of each dot depends on the amplitude of the returning echo, and the position on the screen is based partly upon the time taken for each echo to return to the transducer.
.jpg)
Using B-mode, ultrasound systems can send sequential ultrasound pulses out in different directions to form multiple image lines. This process is completed quickly and repeatedly, creating the typical ultrasound image seen on all systems. Amongst the many ultrasound controls, there is usually a button marked with “B” to return to B-mode, or what can be considered the normal imaging mode (Figure 3).
Figure 3. A typical B-mode image showing the left atrium and ventricle of a dog. Multiple image lines composed of pixels of varying brightness are created and continually updated, forming a real-time representation of the cardiac structures.
Motion Mode
.jpg)
M-mode, or Motion mode, displays the echo data for a single image line over time (Figure 4).
Figure 4. This image shows an ultrasound screen when M-mode is in use. The B-mode image is shown at the top of the screen and the yellow dotted line (red arrow) is superimposed on the B-mode image to show the image line sampled and displayed in the M-mode trace below. The M-mode trace shows the pixels of the selected image line (red arrow) at their respective depths (Y-axis) over time (X-axis). In this case, left ventricular cavity is being assessed and the motion of the mitral valve leaflets can be seen over time (blue box).
M-mode is used for assessing the distance between tissue planes as they move. The most common application of this is in echocardiography for the dynamic assessment of chambers and valves throughout the cardiac cycle.
Most modern ultrasound systems can utilise the Doppler effect (the frequency alterations that occur when ultrasound interacts with moving objects) to quantify the direction and velocity of a moving subject. There are several different ways that Doppler can be applied. However, in general, there are two modes used for collecting Doppler data and two ways in which Doppler information can be displayed.
Pulsed Wave Doppler (PW)
In PW the ultrasound transducer alternates between emitting a single pulse of ultrasound and waiting to receive the returning echoes. Detection of the Doppler effect is only performed within a specific area on the ultrasound beam’s path. This is set via the ultrasound operator positioning a “sample volume” or “sample gate” on the B-mode image.
The advantage of PW is that it is depth specific. The main disadvantage is that due to the waiting time for the machine to listen for the returning echoes, there is a limit to the velocity of blood flow that can be accurately measured. As the time taken for echoes to return increases with the depth of tissue sampled, the maximal velocity that can be assessed decreases with tissue depth.
Continuous Wave Doppler (CW)
In this Doppler system, a continuous wave of ultrasound is produced and returning echoes are simultaneously interpreted by the ultrasound machine. Doppler information is detected for every object along the ultrasound beam’s path.
The advantage of CW is that, unlike PW, higher flow velocities can be accurately assessed. This is especially useful in cases where Doppler is required to assess a high velocity jet of blood flow. For example, in cases of aortic stenosis and to assess the left ventricular outflow tract.
The disadvantages of CW are that the depth of returning Doppler signals cannot be determined and that specific ultrasound transducer designs, such as phased array transducers, are needed to facilitate the continuous emission and simultaneous reception of echoes.
Doppler Display Modes
Once the Doppler data has been collected, the ultrasound system can display it in different ways.
Spectral Doppler
.jpg)
Spectral Doppler displays Doppler data in a graphical format. Velocity is plotted on the Y – axis and time is plotted on the X – axis. Flow towards the transducer is plotted above the baseline and flow away from the transducer is plotted below the baseline (Figure 5).
Figure 5. This image shows a spectral Doppler display. The B-mode image is shown at the top and the position of the sample gate (red arrow) can be seen. Below, the Doppler data is shown in a graphical format with velocity in cm/s on the Y-axis and time on the X-axis. The direction of flow is shown relative to the baseline (blue arrow).
Both Continuous Wave and Pulsed Wave Doppler systems can be displayed in a spectral format.
Spectral Doppler is typically used to characterise the blood flow through heart chambers and valves. Less commonly, it is used in abdominal imaging or obstetrics to assess vascular flow to different organs.
Colour Doppler
In this display mode, Doppler data received by the ultrasound system is displayed as coloured pixels within the sample box shown on the B-mode image (Figure 6). This gives information about direction and a semi-quantitative assessment of blood flow velocities.
.jpg)
Conventionally, data representing flow away from the ultrasound transducer is displayed as shades of blue and data representing flow towards the ultrasound transducer is displayed as shades of red.
Figure 6. A colour Doppler sample box (yellow lines) is positioned over the caudal vena cava in the abdominal cavity. The blue and red pixels are used to represent flow direction relative to the transducer and a velocity scale can be seen in the left of the image, with colour intensity related to flow velocity.
Colour Doppler is the most widely used form of Doppler ultrasound. It has many uses including differentiating vascular structures from other tissues with a similar echogenicity, documenting the presence or absence of blood flow within organs or pathological lesions, and characterising the blood flow in a variety of anatomical regions.
A variation of colour Doppler available on most systems is a power Doppler display. This mode ignores the directional information provided by Doppler shift and displays the total Doppler signal strength as shades of one colour (Figure 7). Whilst it does not display any data on flow direction, power Doppler is a useful tool for examining low velocity blood flow and is more sensitive to flow than colour doppler.
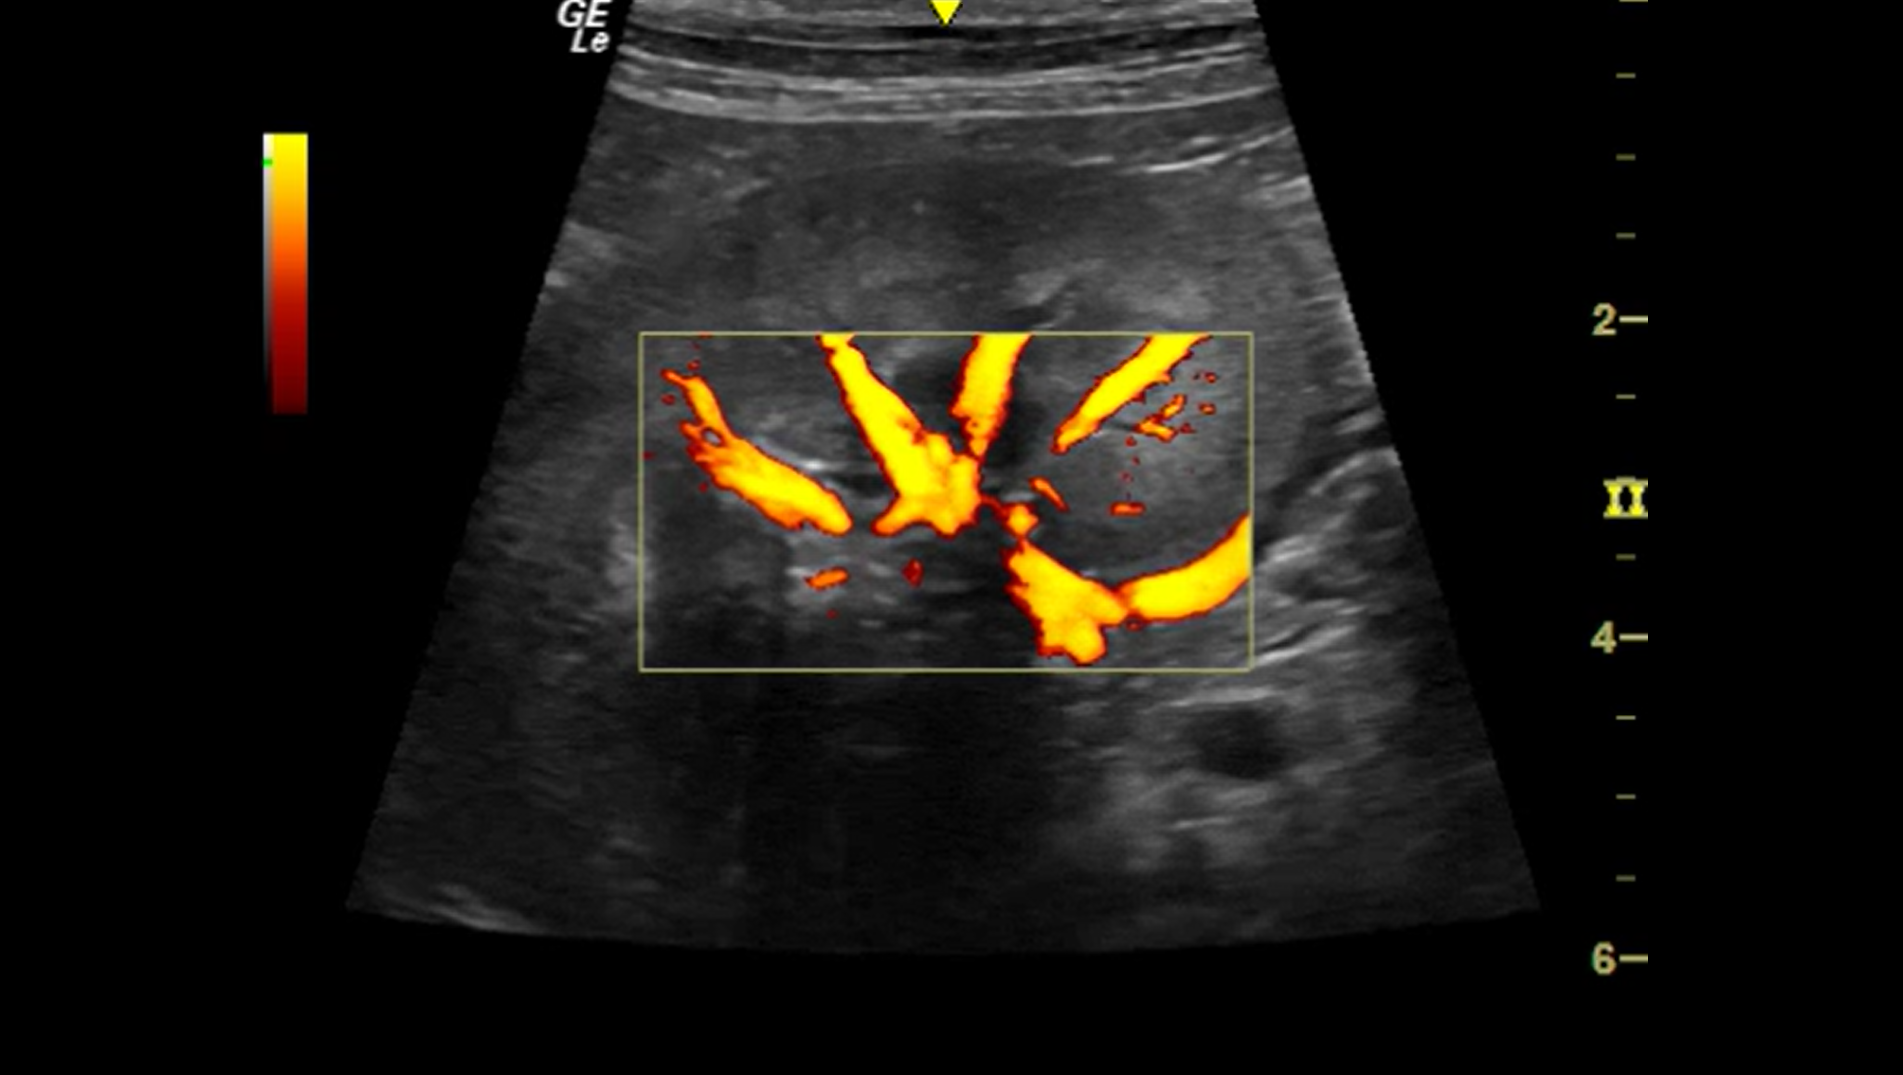
Figure 7. In this image, power Doppler mode is used to show the blood flow within part of the left kidney. The colour scale is shown on the left and, in contrast to colour Doppler modes, directional information is ignored, showing flow as differing intensities of one colour.
Both colour Doppler and power Doppler displays are used to show the data from pulsed wave Doppler. Because Continuous Wave Doppler is not depth specific, it cannot be displayed as colour pixels overlying a B-mode image.
Other Modes?
There are many ultrasound modes available with more specialised functions. Examples include 3- or 4- dimensional scanning modes, elastography, and alternative Doppler applications. However, their use in general practice is very limited, whereas the modes summarised in this article are routinely available on common veterinary ultrasound systems.
How each mode is activated or altered varies with each system/manufacturer. However, each mode provides different information to the clinician, and is part of why ultrasound has become such a ubiquitous imaging modality.
View our Ultrasound Products >>
Related Learning


